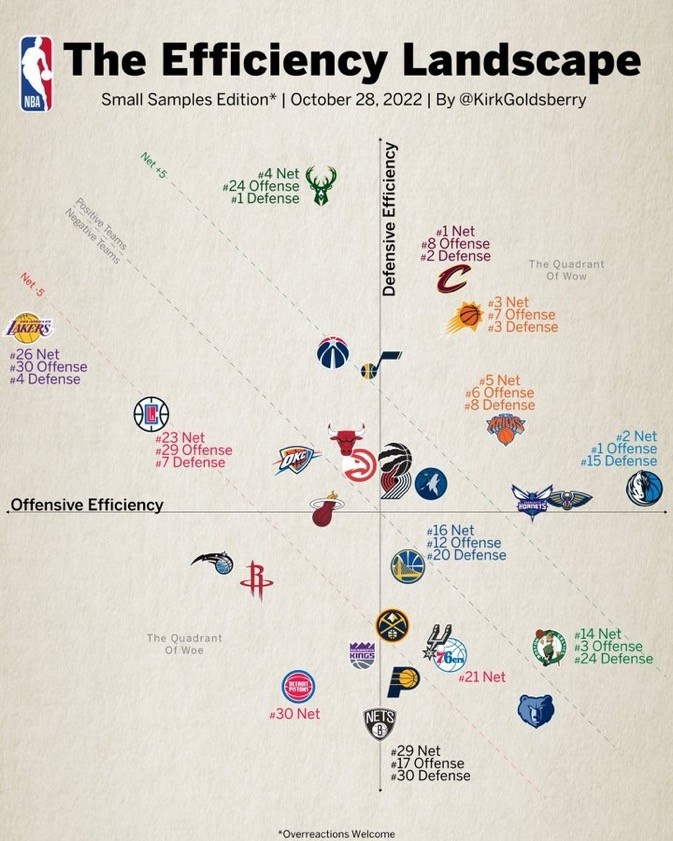
Live broadcast bar, October 28-today’s data expert Kirk Goldsberry showed the attack and defense efficiency chart of all teams in the league so far.
As shown in the figure, the horizontal axis indicates the offensive efficiency (100 rounds score), and the higher the ranking to the right; The vertical axis indicates the defensive efficiency (100 rounds score loss), and the higher the ranking. The closer to the upper right corner, the higher the team’s net efficiency (goal difference rounds).
The top 5 teams with net efficiency values are: 1. Knight, 2. Lone Ranger, 3. Sun, 4. Bucks, 5. Knicks
The soloist attack efficiency is the first, while the stag defense efficiency is the first; While the Lakers attack efficiency is the worst, and the basketable Nets defense efficiency is the worst.
In addition, Warrior attack efficiency 12, defense efficiency 20, net efficiency 16.