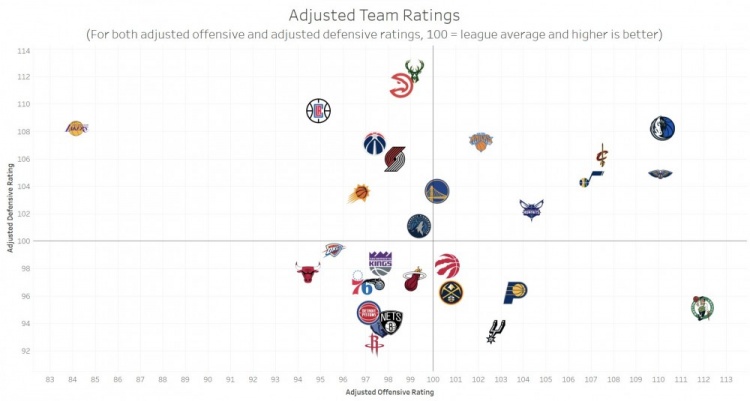
Live broadcast bar, October 24 today, data American media NBA Math posted an efficiency chart of each team in the first two games of the season.
The horizontal axis is the offensive efficiency, the vertical axis is the defensive efficiency, and the average league value is 100 (the average value is revised, the higher the value, the stronger the value), that is, the more right the team is, the higher the offensive efficiency, the more the team is, the more efficient the team is.
From the figure, it can be found that the Lakers’ defense efficiency is not bad, but the attack efficiency is unique. The attack efficiency of the Lone Ranger, Pelican and green army is the best, while the defense efficiency of the Eagle and the stag is the best.
(Ouch)